
Up your Azure monitoring game with Azure Data Source for Grafana
Grafana is the leading open source platform for beautiful time series analytics, visualization and monitoring. The Azure Monitor Data Source for Grafana is a Grafana plugin which lets you consume and visualize metrics from Azure Monitor, Application Insights and Log Analytics on Grafana. With the Azure Data Source, you can easily and quickly build rich, eye-catching & impactful dashboards without making any changes to your application / infrastructure.
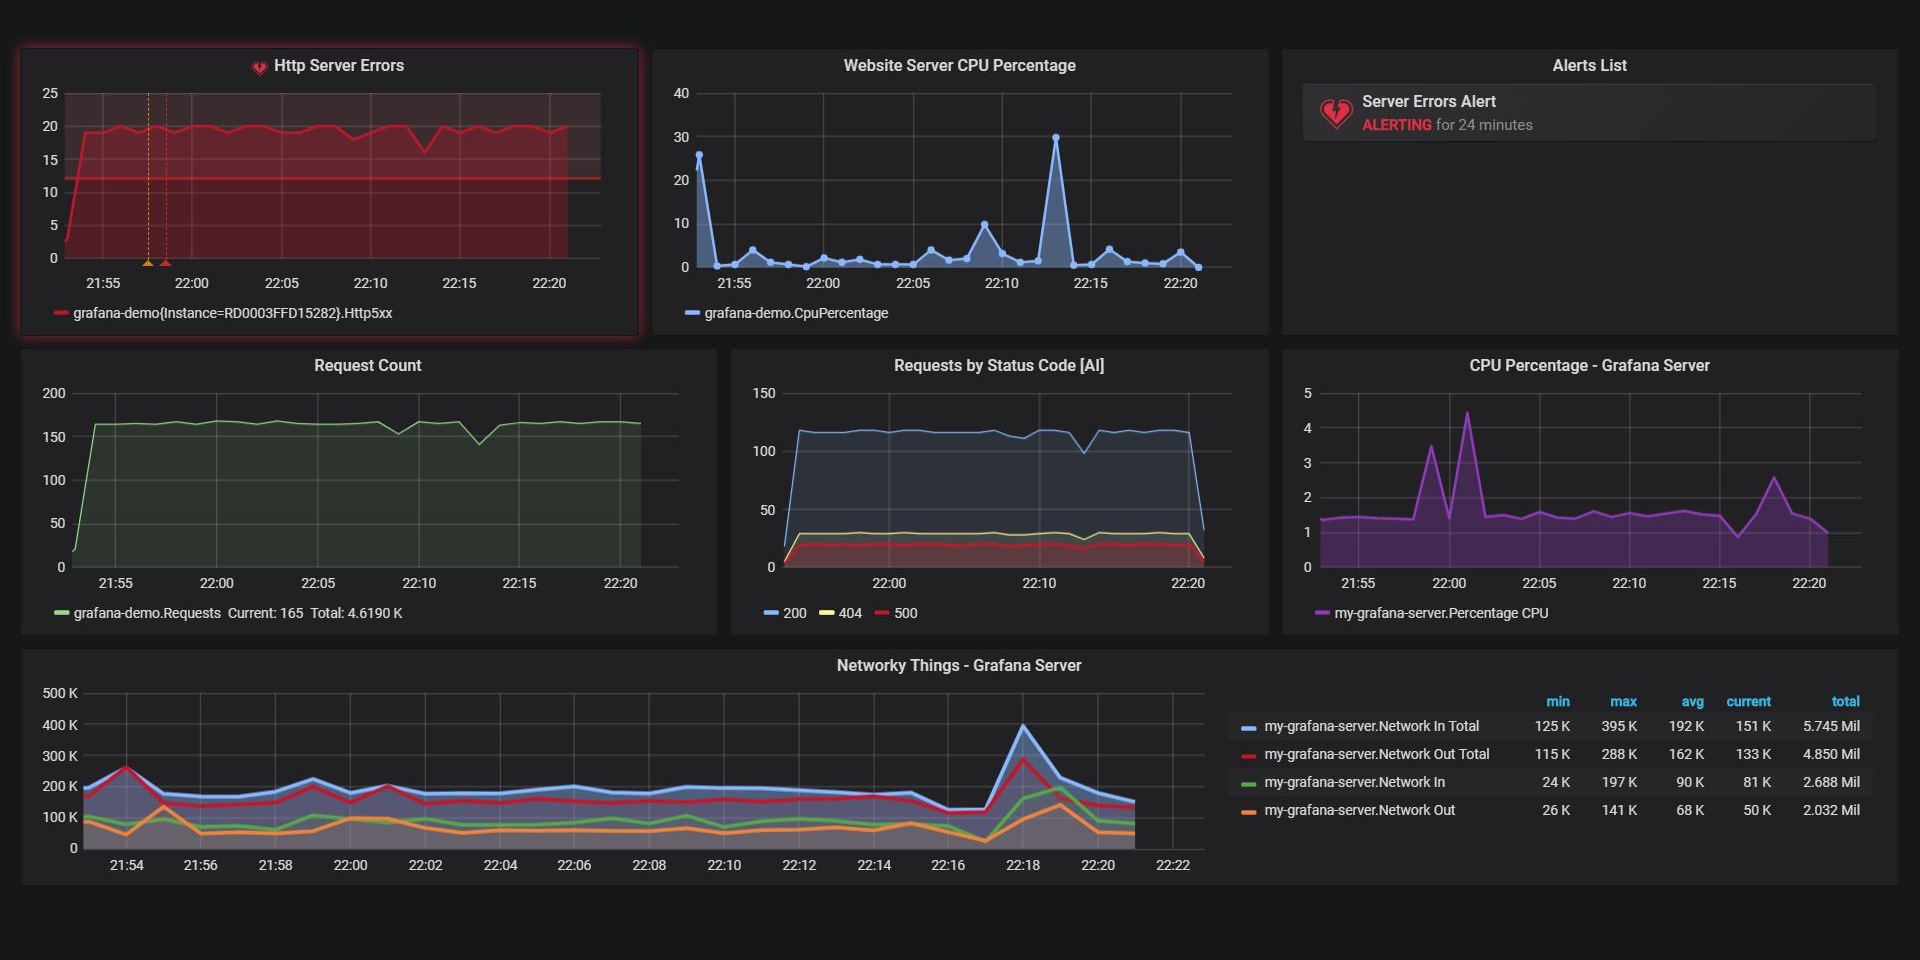
The picture above is a screenshot of a sample dashboard. The Grafana dashboards offer additional capabilities when compared to Azure’s built-in dashboards. Some features that Grafana excels at are
- Great customization options (colour, stacking, legends etc.,)
- Ability to zoom-in / out and drill down on charts
- Supports dynamic charts thanks to variables
- Provides more alerting integrations*
*Currently, only limited alerting is possible for the Azure Data Source but this is being worked on and is expected to be fully available in the next release (6.2).
Although Grafana offers these extra features, you still need to host your instance of grafana on a server and that incurs some additional (and usually negligible) cost while the Azure Dashboards are a free offering.
1. Setting up Grafana and the Azure Data Source on an Ubuntu VM on Azure
You can install and run Grafana on Windows, Linux or Mac and there is even a docker image available if containers are your thing. This post will only cover how to set this up on an Ubuntu VM in Azure. To complete the entire process, you will need enough permissions to
- Create a Ubuntu VM on Azure
- Register an application on Azure Active Directory and provide it access to the resources (subscription / resource group / resource ) you would like to monitor.
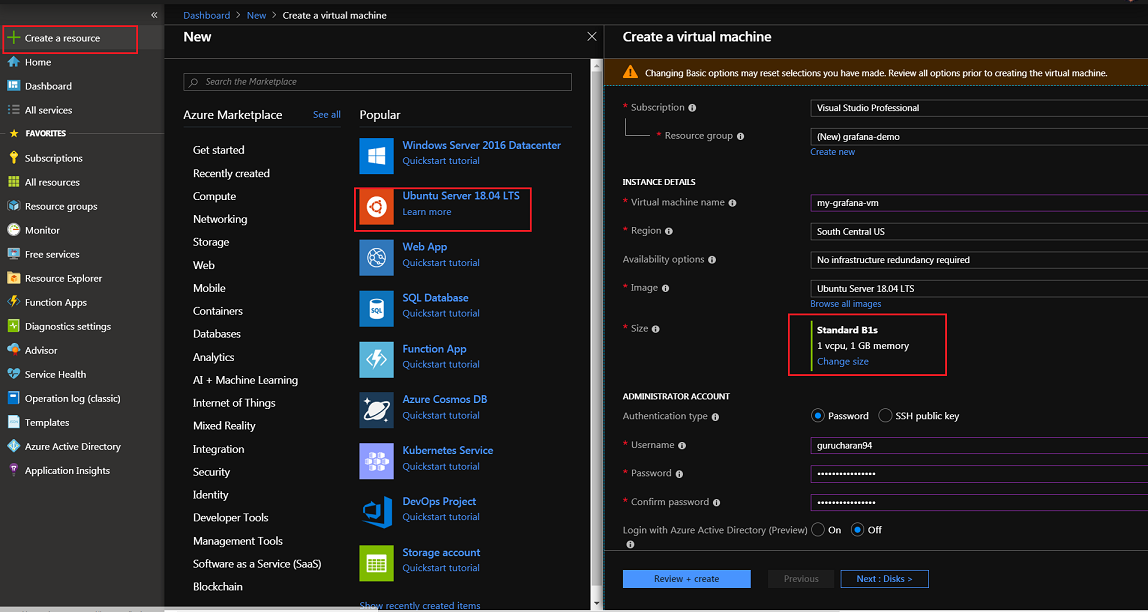
1.1 Create an Ubuntu VM on Azure
I assume that you are familiar with the process creating a VM on Azure and so I will not spend time explaining the steps in detail. Here is a link to the official docs on creating a linux VM in case you need it. For the purpose of this tutorial you would need to
- Create a VM with Ubuntu 18.04 LTS image
- Choose the Standard B1s size which is the smallest size that meets the minimum system requirements of 255 MB RAM and a single CPU to run Grafana
- Open up ports 80 (http) and 22 (ssh)
This is the cloud, you can anyways scale up later if needed. So hit create and wait till the VM is created and in the meanwhile, go grab a coffee or something.
1.2 Install Grafana on the Machine
Now that the VM is created successfully, browse to the VM, get the IP address to connect to, fire up a terminal and ssh into the machine. Now it’s time to install Grafana. As of writing, the latest version available in 6.1.4 and you can run below commands inside your VM to install said version.
## ssh into the Azure VM
## Download and install Grafana
wget https://dl.grafana.com/oss/release/grafana_6.1.4_amd64.deb
sudo apt-get install -y adduser libfontconfig1
sudo dpkg -i grafana_6.1.4_amd64.deb

## Start grafana as a systemd service
systemctl daemon-reload
systemctl start grafana-server

## Enable the systemd service so that Grafana starts at boot.
sudo systemctl enable grafana-server.service

## Check grafana status
systemctl status grafana-server
You should see a message stating Grafana service is loaded and active (running). You have successfully installed Grafana as a systemd service and it is responding to requests from it’s default port 3000. Port 3000 is great but I really don’t like typing in a port number in my browser’s address bar. Let’s fix that and get Grafana to run on port 80.
You can do that by modifying the config files located at /etc/grafana/grafana.ini. Open the configuration file in your favorite text editor, find the line which says ;http_port=3000 and change it to http_port=80. Save and exit
# Gives grafana permissions to run on port 80
sudo setcap 'cap_net_bind_service=+ep' /usr/sbin/grafana-server

# Restart Grafana for the changes to take effect
sudo systemctl restart grafana-server
systemctl status grafana-server
PRO TIP : Remember to delete the semi-colon at the beginning of the line. Anytime there is a change to the grafana.ini file, grafana has to be restarted for the changes to take effect.
You should be able to access your grafana instance through the DNS Name or the public ip address of your VM from your browser. You should see the grafana login screen. Login with the default credentials which is admin / admin and reset the password to something stronger.
1.3 Install and Configure the Azure Monitor Data Source
Remember, I told you that you would need permissions to create an application in the Azure Active Directory. Now would be a nice time to exercise that permission. Create an application in the active directory and here is a link to the docs explaining how..
Give the app an appropriate name and take note of the following properties of the app that you just created. You will need them in a short while.
- ApplicationID
- TenantID or DirectoryID
- Password / Secret Key
Now you need to provide Log Analytics Reader Permission to the newly created AD app on the Subscription / Resource Group that you want to monitor like in the screenshot below. The resources you would like to monitor can be a completely different subscription to the one that you host Grafana in.

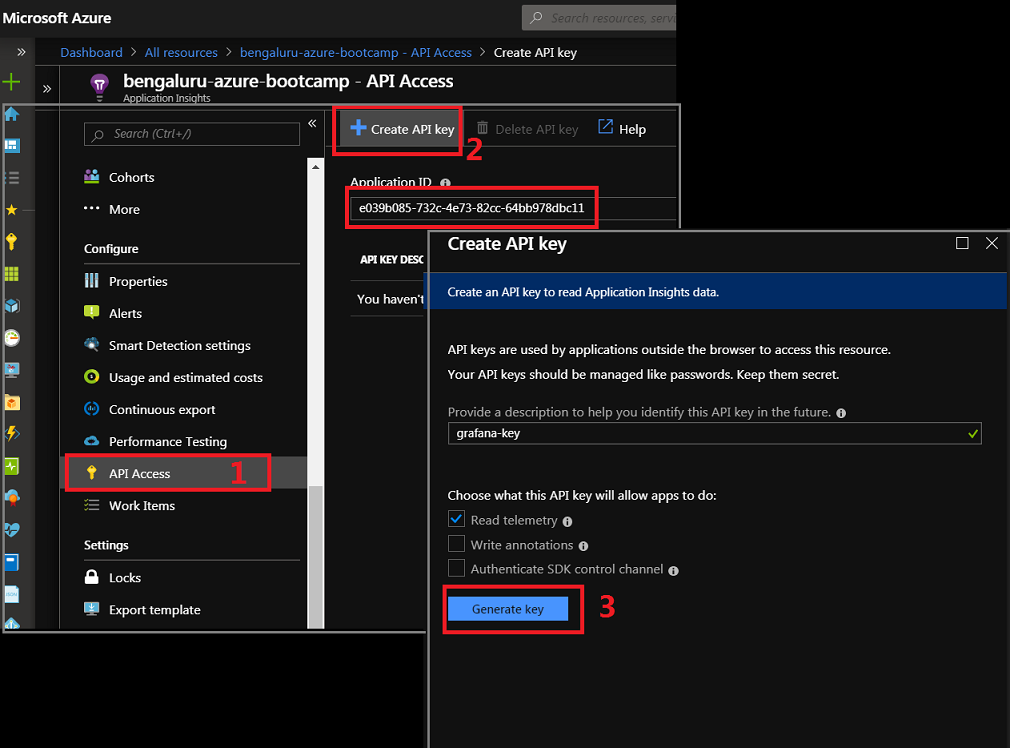
If you have an app insights instance lying around, take note of the Application ID and API Key as shown below.
The final step is to configure the Azure Monitor Data Source to use the Azure AD App that we just created. To do that, head over to your grafana instance, click the gear icon on the left navigation pane and choose Data Sources. Select the Azure Monitor Data Source and enter appropriate details which is available from the previous step. As far as the Log Analytics API configuration is concerned, you can enable the same details as above switch.
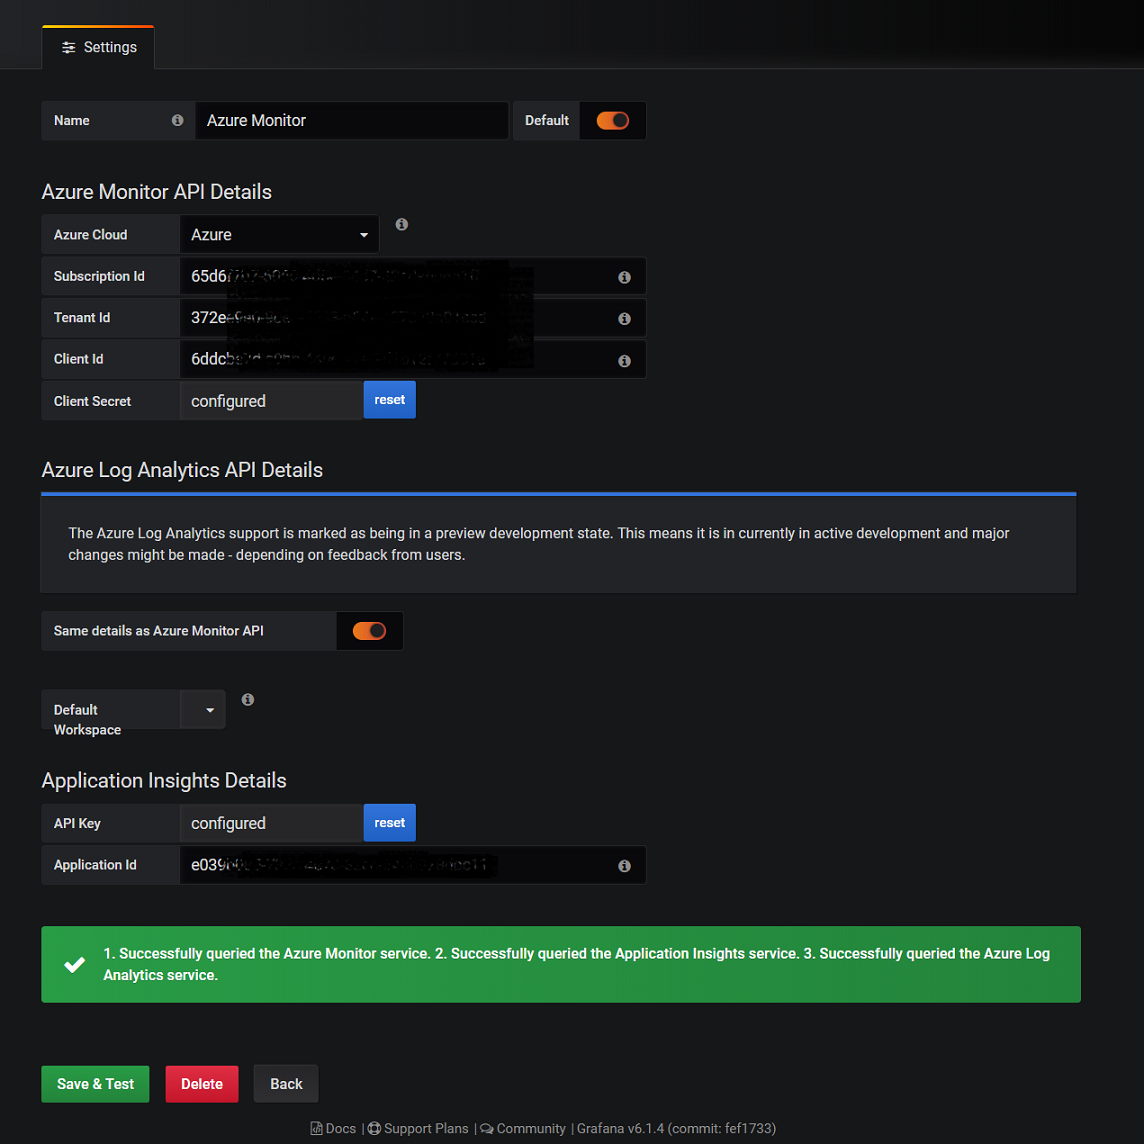
When you hit save and test, you should finally see a green banner saying everything is successful. Refreshing the page will populate all the Log Analytics Instances that you have and you can choose which one should be used as the default.
Creating Dashboards
You can read about the basic building blocks of Grafana from their getting started guide.. Then create a new dashboard by clicking on the + icon on the left pane, click on choose query on the panel. You can create a sample query like the one shown in below diagram.
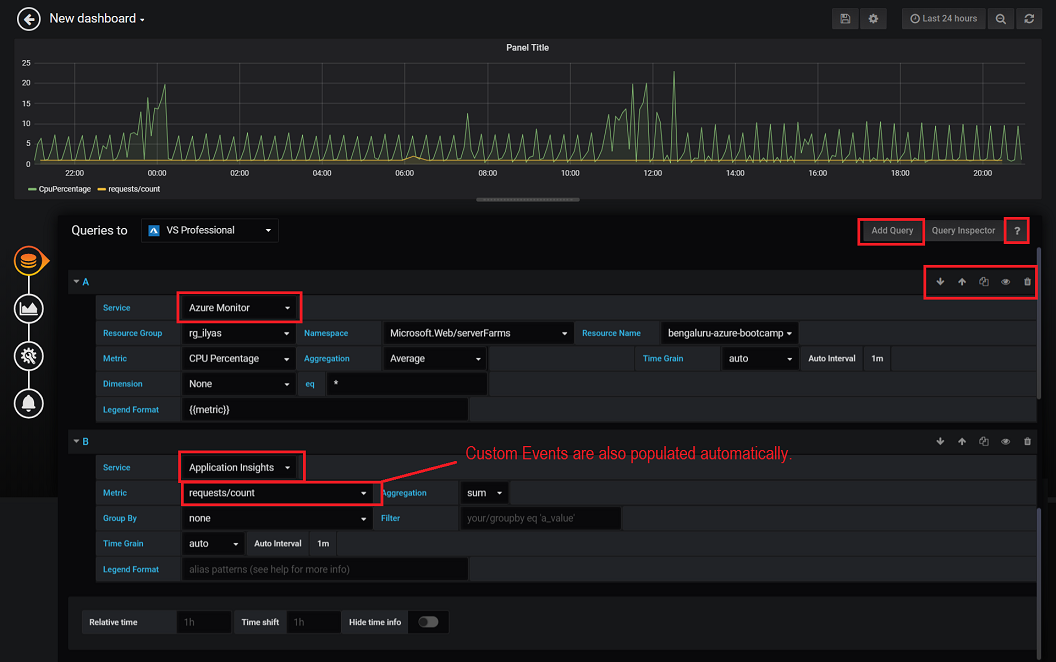
Choosing Azure Monitor for the service drop down allows you to choose the resource that you want to visualize and all metrics that Azure exposes are available in the dropdown. In similar fashion, all the built-in and custom metrics / events from application insights are available for quick and easy visualization. Yes, custom metrics are supported out of the box.
As far as log analytics is concerned, you can bring your existing queries and get it to work inside Grafana seamlessly. The only catch is that you need to sort the results by timestamp while fetching it from Azure. It makes sense to fetch the data in a sorted fashion rather than let Grafana do the sorting.
With the cross workspace query feature of Log Analytics, you can query not only across multiple Log Analytics workspaces, but also data from a specific Application Insights app in the same resource group, another resource group, or another subscription.
With Grafana, you can choose to visualize data from multiple Azure resources, Application Insights instances and Log Analytics queries inside a single panel. How nice is that !!!
Dynamic Graphs with Variables
This is my favorite feature hands down and one of the main areas where Grafana stands out. From the docs,
A variable is a placeholder for a value. So when you change the value of a variable, using the dropdown at the top of the dashboard, your panel’s metric queries will change to reflect the new value.
Variables let’s you create dashboards that are for more interactive and dynamic and you can avoid a lot of hard-coded things.
## Sample Query using Grafana's Built-in Variables for Log Analytics
app("my-app-insight").customEvents
| where $__timeFilter(timestamp)
| summarize count() by Category, bin(TimeGenerated, $__interval)
| order by timestamp asc
Built-in Variables for Log Analytics
To make log analytics queries simpler, Grafana provides built-in variables like $__timefilter and $__interval.
-
$__timefilter(timestamp)expands totimestamp > fromdate and timestamp < todatewhere the fromdate and todate are replaced with values from the time-picker. -
$__intervalcalculates the minimum time grain that can be used to group by time in queries.
You can discard these variables and use a standard time filter in your queries, such as timestamp > ago(1h), but that means your panels won’t respect Grafana’s time picker and also won’t be able to zoom in on a graph.
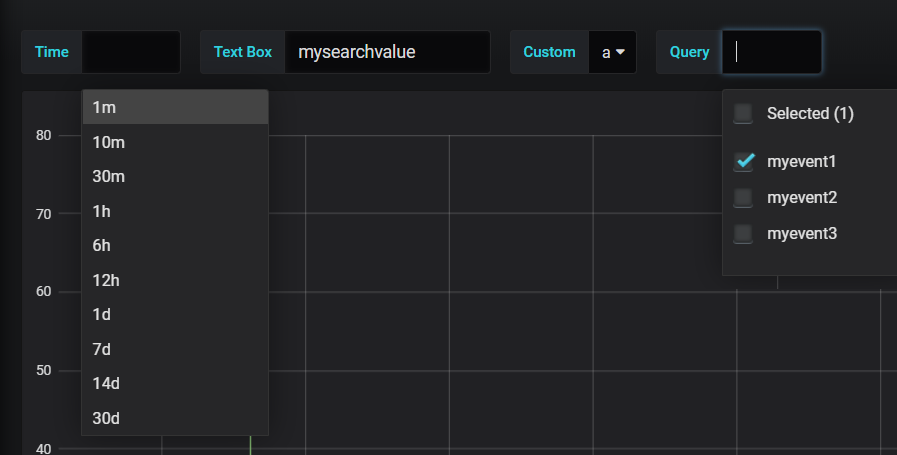
Custom Variables
With variables, your queries can be parameterized and the parameter values can be selected through UI dropdowns, and automatically updated in the query. You can create new variables on the dashboard settings page (gear icon to the left of the time picker). I found the following variable types extremely helpful in creating dynamic queries.
-
Text Box - This is a text input field with an optional default value.
-
Custom - Define the variable options using a comma separated list and renders in the UI as a dropdown.
-
Query - You can type in any app insights query like
app("my-app-insight").customEvents | distinct name. This would populate all the custom events as a drop down list that you can choose from in the dashboard UI. -
Interval - You can use this to override the
$__intervalvariable which is default time grain calculator without editing your queries every single time you choose a different time window.
Below is an example of a parameterized query using variables. Queries can refer to variables using the $variablename syntax.
## Fictional query using Grafana's Built-in Variables for Log Analytics
app("my-app-insight").customEvents
| where $__timeFilter(timestamp)
| where name in ($myCustomEventsQueryVariable) ## Supports Multi-select as well
| summarize count() by Category, bin(TimeGenerated, $_myintervalVariable)
| order by timestamp asc
You can find more details about the different variables and macros available to you.
Alerting Options
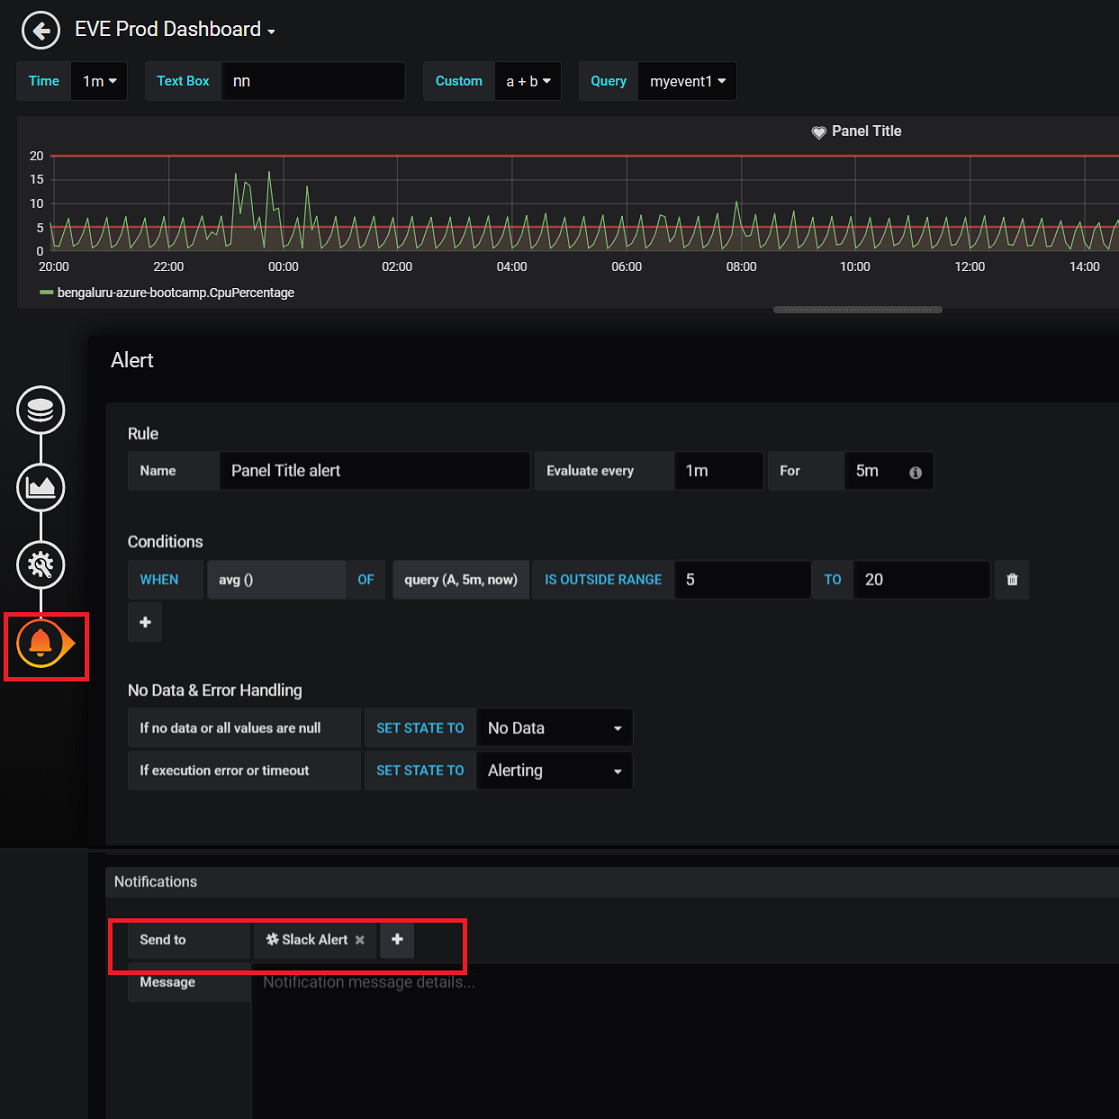
The Azure Monitor Data Source supports alerts only for Azure Monitor Queries as of writing. Alerts for Application Insights and Log Analytics Queries should be available in a future release. You can configure an alert notification channel as shown below. Grafana offers multiple alerting integrations out of the box like E-mail, Webhooks, Slack, MS Teams, PagerDuty, OpsGenie etc.
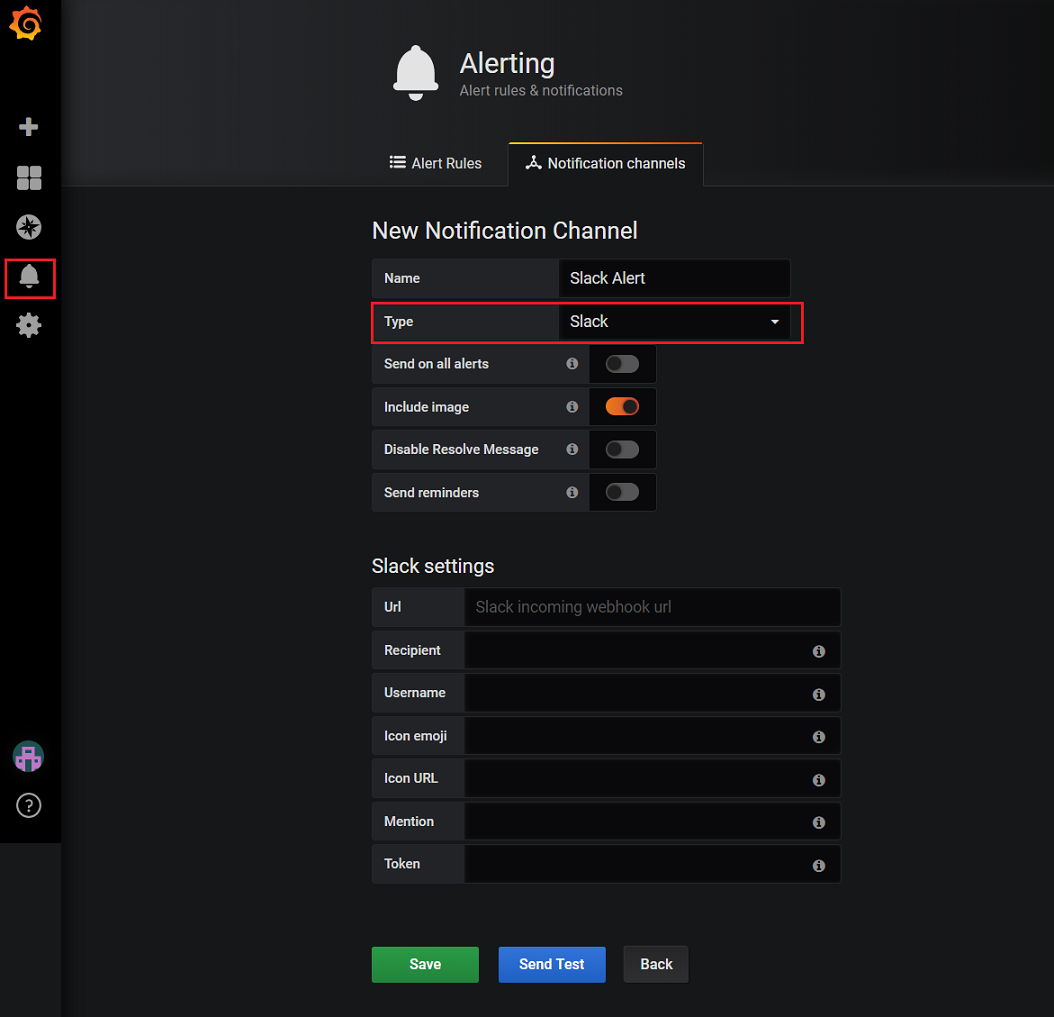
I have configured a slack as a notification channel for this post. You can then configure alert rules in the individual panels. Each panel supports multiple alert conditions (or rules) that can be chained together using AND / OR operators. Each alert can also be sent to multiple channels like Email, Slack etc., as expected.
The alert thresholds are also visible in the panels and whenever the alerts are firing, you can see a blinking red border around the alerting panel, giving a real sense of urgency.
Closing Remarks
There are tons of other nuances and configurable options like the panels customization, playlists, annotations and authentication using single sign-on etc., The grafana docs are super detailed about these configurations and I’ll let you explore them on your own from the official docs.
Like I said at the start, Grafana offers a lot of customization options but the deciding factor for me to move from Azure Dashboards to Grafana is the ability to create dynamic charts with variables. The notifications supports a lot of integrations out of the box but limited to Azure Monitor Queries only right now (this might change very soon) and this is something to consider as well.
Did you like this post ?
Please take some time to provide feedback with the reaction buttons below. If you think that something that can be better explained or done differently / better, leave a comment.
If you enjoyed this post, help spread the word by sharing this with your friends using the buttons below. Thank you !!