
Annotate Grafana Dashboards with Deployment Details from Azure Pipelines
This blog post shows you how to add rich information from your Azure Devops deployments inside your Grafana time-series charts.
If you are new to Azure integrations on Grafana, you should read my blog posts on configuring Azure Monitor Data Source for Grafana and how to run Grafana using Azure Web App for Containers.
Grafana Annotations
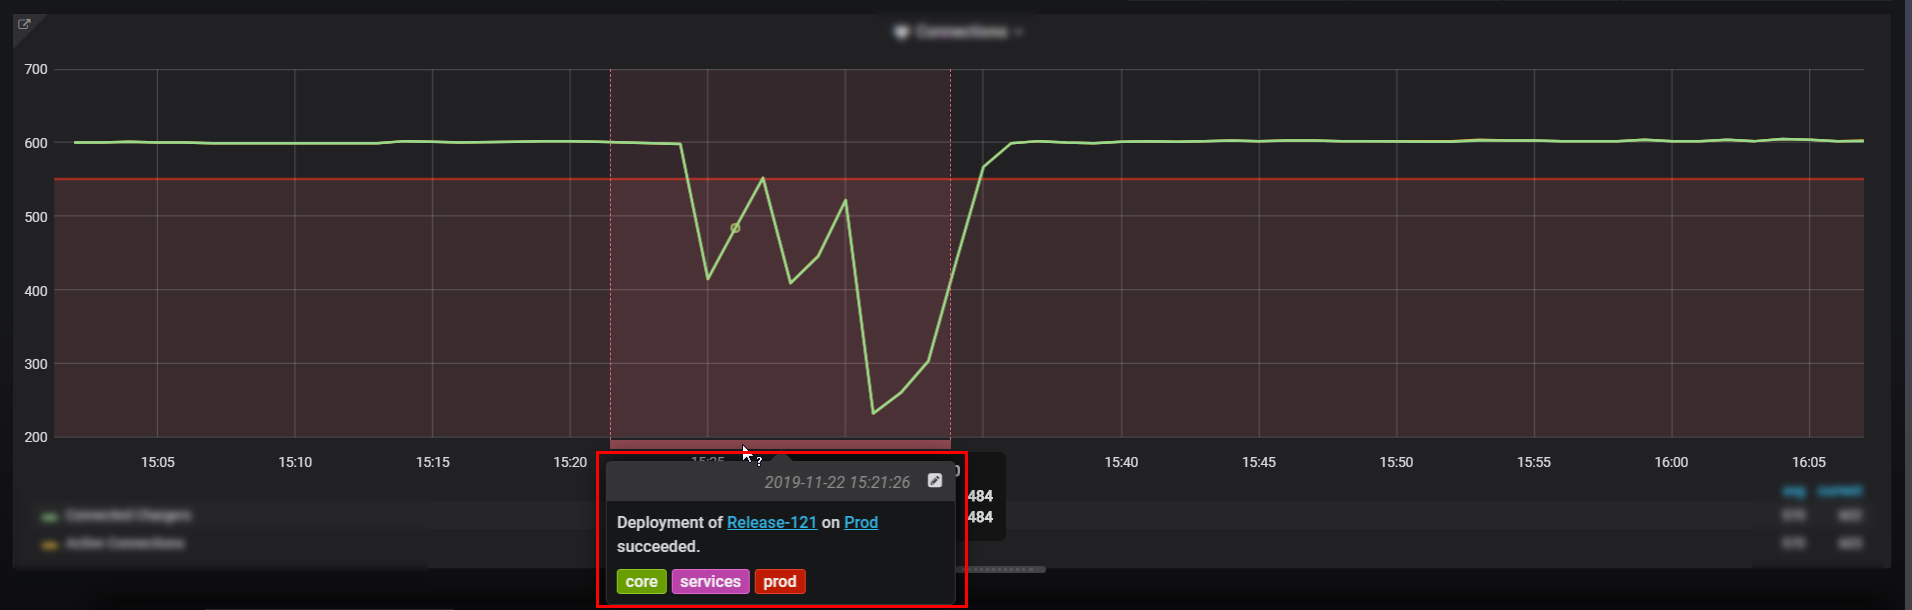
From the Grafana docs, annotations provide a way to mark points on the graph with rich events. When you hover over an annotation you can get event description and event tags. The text field can include links to other systems with more detail. To add an annotation, you simply Ctrl + Click or Ctrl + Select a region on the graph panel.
Now that we have covered the basics of annotations, we can look at how to depict deployments in Azure Devops with rich details inside Grafana. Azure Devops has built-in integration with Grafana and it is fairly simple to configure and consume. Head over to the project settings page and click on Service Hooks. You can add a new service hook and you should have an option to add a Grafana integration.
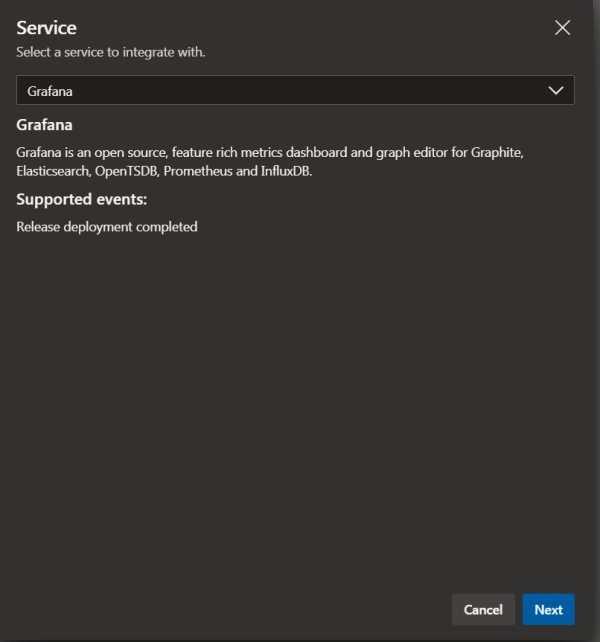
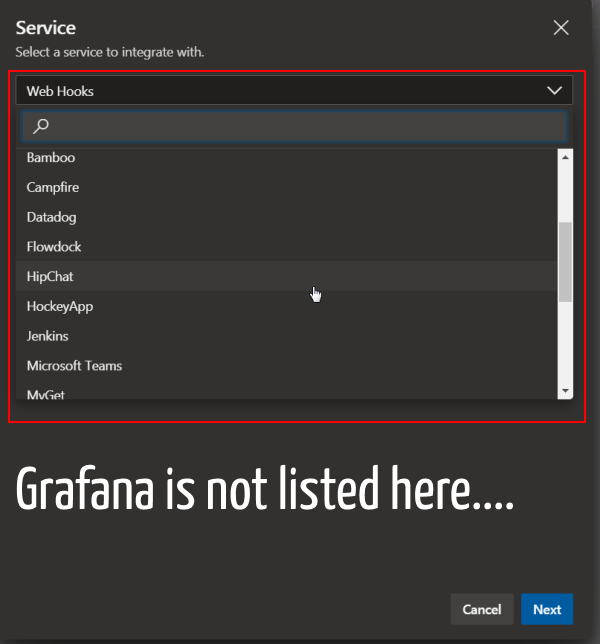
If the Grafana option does not show up, try refreshing a couple of times. The new UI for Service Hooks has some bugs. For example, take a look at the screenshot below where Grafana is not listed.
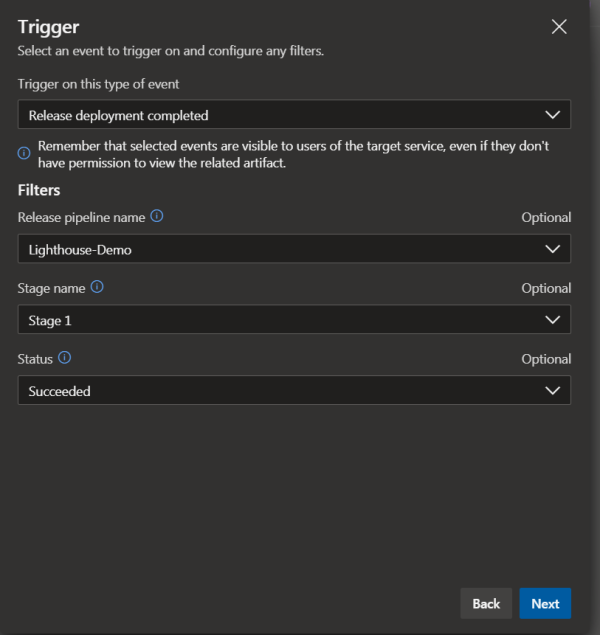
After choosing Grafana, you can see that the service hook can be triggered whenever a deployment to a stage in the release pipeline completes. If you continue on the configuration page, you can choose your pipeline, stage and deployment status for which you need the service hook to trigger.
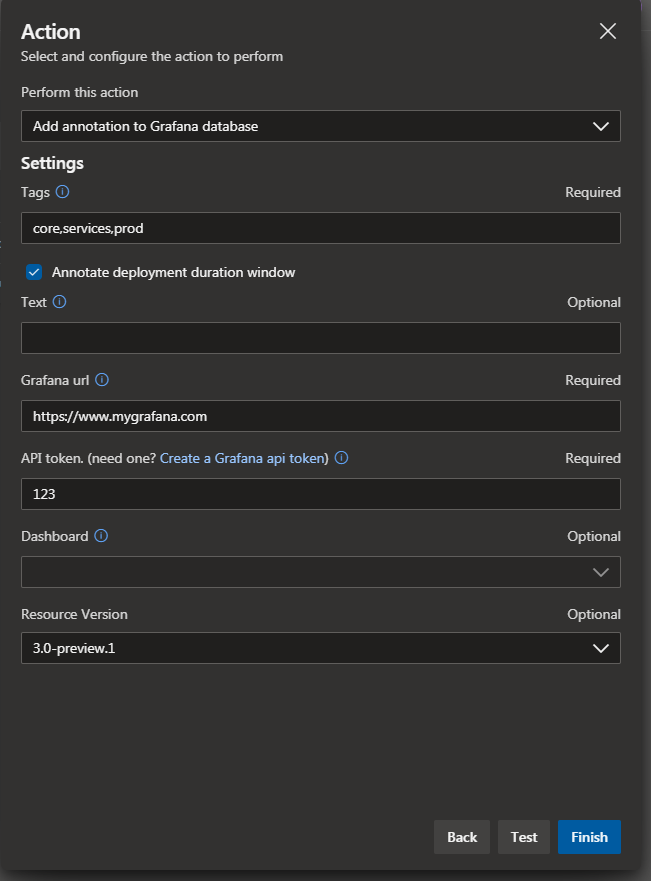
Then you continue to the final page of the configuration steps and enter appropriate tags, enter your Grafana URL and API token. You can then test the configuration and finally hit save.
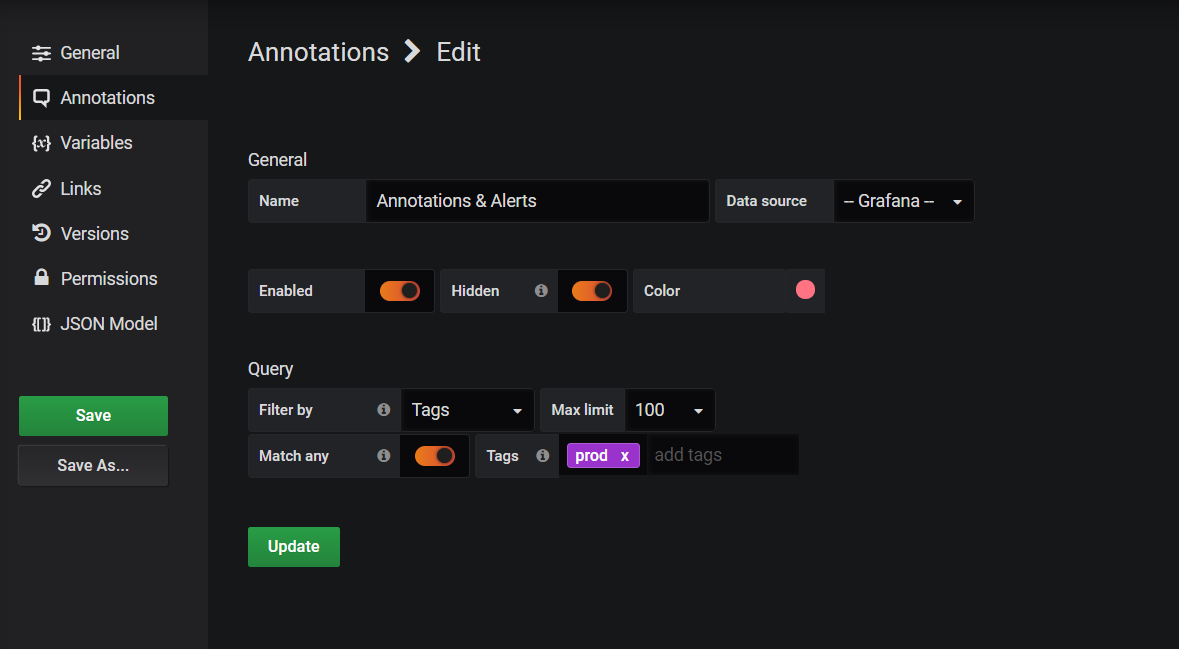
The last thing you have to do to get the annotations to show up in your graph panels is head to your instance of Grafana and open dashboard settings. You can choose an appropriate colour for your annotation markers and filter what tags show up in your dashboards. Here is a screenshot of a sample configuration.
Now, the next time a deployment occurs on the configured pipeline, you should see a nice marker with rich data that you can trace back to your deployments inside Azure Devops. This is very useful in situations where your production environment metrics begin to act strange and you have to decide if a recent deployment may have played a role without having to search for information in multiple places.